The Great Depression: The Movie
Over the past few weeks I posted the first three narrative chapters of my manuscript on the Great Depression. Some people have suggested that graphs would help readers better grasp what is admittedly an often confusing and complicated analysis. So I have been working on creating some new graphs. It might be helpful to review the gold model of the price level before getting into the graphs:
1. There was severe deflation between 1929-33
2. Under a gold standard deflation is equivalent to a rise in the relative value of gold.
3. The supply of newly-mined gold grew fairly steadily during the 1930s.
4. Point 3 implies the sharp fall in the price level was attributable to a large increase in the demand for gold.
5. The demand for gold can rise for one of three reasons:
a. More private demand for gold (due to fear of currency devaluation.)
b. More currency hoarding (due to fear of bank failures.) Currency must be backed by gold.
c. A higher gold currency ratio. Central bank gold hoarding is due to . . . well, some would saydue to central bankers being cruel, heartless people who worry more about a tiny bit of inflation than they do about mass unemployment. Every so often they see “excesses” in the economy, and decide it’s time for a little liquidation and deflation. One of those times was late 1929, when the stock market seemed to be reaching insane levels. I recall reading one news story written in the early 1930s where the pundit argued that the prosperity of the 1920s had been unsustainable, it was reaching to point where every working man expected to own an automobile, and icebox and a radio. The party couldn’t last forever. At least that was the Fed’s excuse.
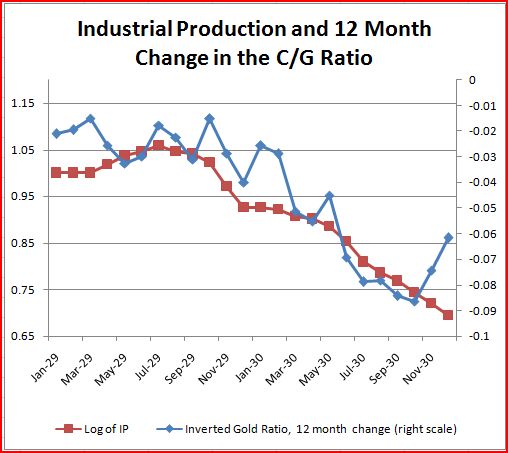
So between October 1929 and October 1930, the world’s central banks increased the world gold reserve ratio by 9.6%, driving the global economy into a severe slump. It is very time-consuming to calculate monthly world gold reserve ratios, so in the next two graphs you’ll see estimates based on eight major economies that held nearly 2/3 of the world monetary gold stock. (The actual rise in the gold ratio was even a bit larger than what is shown of the graph.) Because increases in the gold ratio are deflationary, I inverted the ratio in these two graphs to make it easier to see how it was correlated with monthly industrial production and wholesale prices. The fall in the blue line (C/G) is actually a rise in the gold ratio (G/C.)
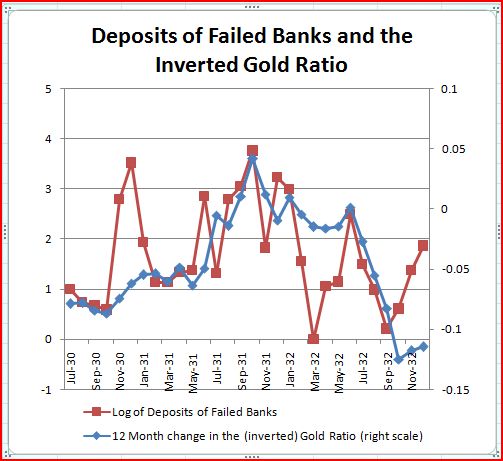
Note the upswing in the C/G ratio after October 1930. This was the point where the first American banking panic started. After October 1930, currency hoarding replaced central bank gold hoarding as the biggest deflationary factor. Because the Fed partially (but not completely) accommodated this demand for currency, C rose faster than G and the C/G ratio started rising as the gold reserve ratio fell in late 1930. The next graph shows how the upswing in bank failures affected the gold ratio between mid-1930 and the end of 1932. Again the gold ratio is inverted, so the relatively high growth rate of C/G in 1931 reflects the fact that the currency stock was now rising as fast as the monetary gold stock. By 1932, however, central banks resumed hoarding gold in massive quantities, and the C/G ratio fell again as the gold ratio increased. Thus a rising gold ratio (central bank hoarding) was a key deflationary force in 1930 and 1932. Currency hoarding was relatively important from November 1930 to January 1932.
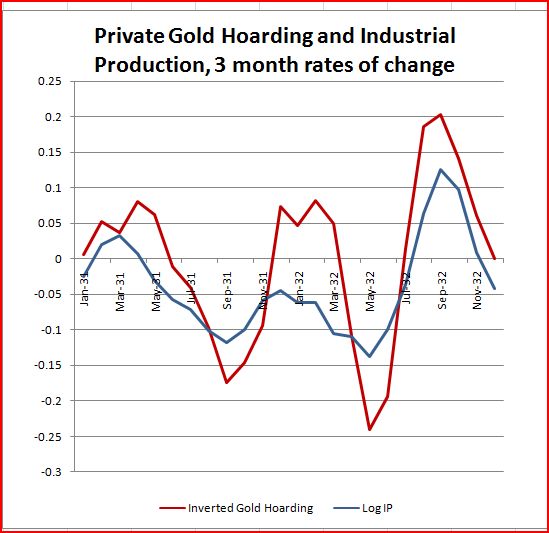
It wasn’t until mid-1931 that private gold hoarding became a major deflationary force. This is a factor that (as far as I know) all modern economists missed. Note that in the next graph the periods of private gold hoarding were associated with sharp declines in industrial production. (I inverted the gold hoarding series so that it is easier to see this correlation.) The two biggest periods of gold hoarding were associated with the German/British Crisis of July-September 1931, and the US dollar crisis that occurred during the expansionary monetary and fiscal policy of April-June 1932. Reverse causality arguments are implausible because there was no significant gold hoarding during the October 1929 stock crash or the November 1930 banking panic. Gold hoarding is triggered by devaluation fears, not stock crashes and banking panics. If the prices of stocks and commodities fall during periods of gold hoarding, the most likely explanation for causality runs from gold hoarding, to an increased real value of gold, to lower stock and commodity prices.
Many accounts of the Great Contraction (notably Friedman and Schwartz) tell a bogus story where the Spring 1932 open market purchases by the Fed led to a modest recovery later in the year. The famous “long and variable lags” story. Sorry, but this monetarist explanation just doesn’t hold up. Note that stocks, commodity prices, and industrial production all fell very sharply during the spring of 1932. This was the period when the Fed bought over a billion dollars in securities. Why didn’t the open market purchases work? Because a huge gold outflow mostly sterilized the impact of the purchases, leaving the base only about $300 million higher. The gold outflow (which also reduced the world monetary gold stock, something other economists missed) led to bearish expectations.
I suppose one could argue that exogenous monetary policy shocks could affect output with a long and variable lag (although the evidence from the 1930s strongly suggests otherwise), but one certainly cannot make that argument regarding the flexible prices of commodities and stocks. If the open market purchases had been expected to boost output with a lag, asset prices would have risen immediately. Instead they crashed in the spring, and only began rising after the OMPs ended, the dollar panic ended, and gold started flowing back into central bank coffers. Unfortunately Hoover election gaffes led to another run on the dollar late in 1932, and a promising recovery was snuffed out in the final few months of the year.
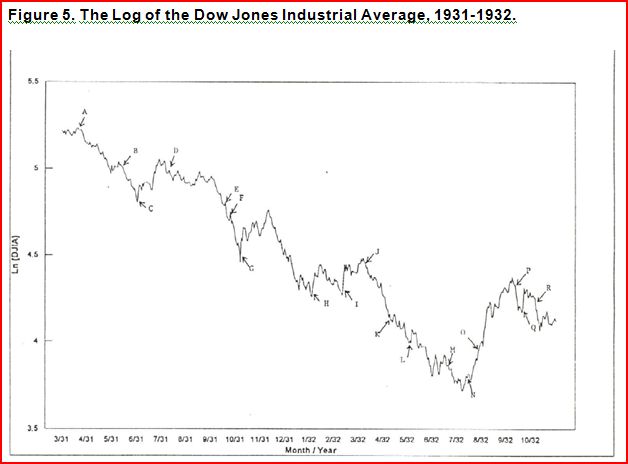
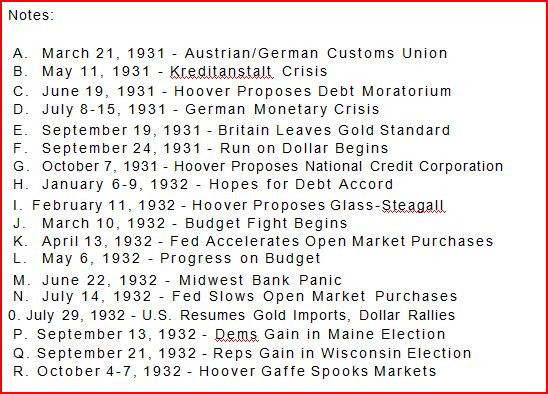
The following graph should have been included in the earlier posts containing chapters 5 and 6. If anyone is still interested, and can overlook the poor quality of the graph, you will see a timeline for the events that impacted stock prices in 1931-32, which I discussed in those two chapters. Note that stock prices in 1931-32 were much more volatile than in modern times, and also much more volatile than in the 1920s.
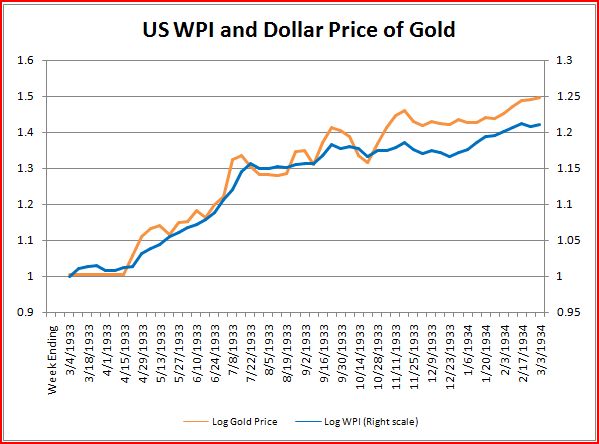
Finally we get some serious reflation, but not right away. During FDR’s first 6 weeks he provided some inspiring speeches, and began fixing the banking system. He also banned private gold hoarding. But the economy was still in pretty poor shape as late as mid-April, and stocks were going nowhere. Then he devalued the dollar and everything took off like a rocket in the last two weeks of April; the price of gold, commodities, stocks, industrial production, etc, all shot upward. I have another post that discusses the following graph; here I have merely improved the vertical scales. FDR ignored all of his respectable advisors, and went with George Warren’s suggestion that a policy of reflation could be achieved through an increase in the price of gold. He set a target of returning prices back up to 1926 levels. Of course “level targeting” is also a policy that Bernanke recommended to Japanese, but the Fed itself failed to engage in level targeting when we slipped into our own deflationary liquidity trap in late 2008.
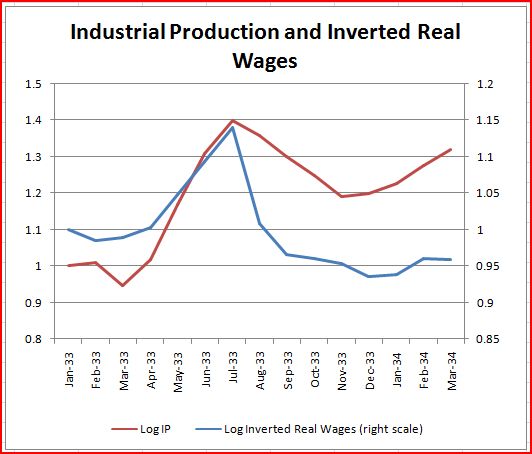
Unfortunately FDR couldn’t leave well enough alone. He issued an executive order that effectively raised nominal wages rates by over 20% between late July and September 1933. Because wholesale prices had leveled off by then, real wages rose by almost as much. Stocks crashed. Industrial production immediately started falling, not to regain its July 1933 levels for another 2 years. Prior to the NIRA wage policy it looked like we were recovering even faster than in 1922. And the recovery was occurring for the same reason—real wages were falling. The following graph shows how closely the turning points match up. Again, I inverted real wages so that you can more easily see the correlation. From March to July 1933 real wages fell sharply, as prices soared and nominal wages were flat. Output also soared. Then after July 20 both nominal and real wages rose sharply, and output fell. Toward the end of the year FDR got worried and pushed the dollar even lower. This again raised prices, and slightly lowered real wages. It allowed the recovery to resume, but at a much slower rate than in the spring and summer.
If you are wondering why the two series gradually diverge, recall that IP has a strong upward trend, especially when the economy is recovering from a deep depression. Real wages also have an upward trend in the long run. So when I invert real wages you would expect the inverted series to gradually fall relative to IP.
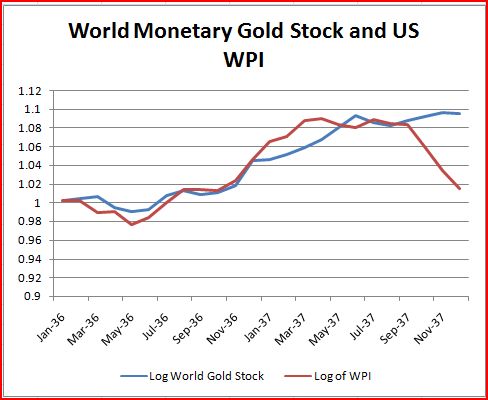
Perhaps you are bored, so let’s jump ahead to 1936. The NIRA was ruled unconstitutional in May 1935, and IP began a rapid increase that would extend into early 1937. Wholesale prices were fairly stable, and nominal wages declined slightly. After France left the gold standard in September 1936, only the US and Belgium remained on gold. Gold began to pour back into central bank coffers, now that the currency devaluations feared by hoarders had actually been realized. Prices started rising rapidly, despite the fact that the Fed had sharply raised reserve requirements in August 1936, and began sterilizing gold in December 1936. These contractionary monetary policies were simply not credible. The press was full of stories suggesting that the massive flow of gold to the US would eventually force monetary expansion, and the value of gold fell in anticipation. Since the US was still on the gold standard, a fall in the value of gold was equivalent to a rise in wholesale prices. By April 1937 a full-fledged “gold panic” was in effect, as investors began to fear dollar revaluation. A revaluation was unlikely, but would be a sort of “nuclear option” if there was no other way of containing inflation.
In fact, soon after the gold inflow problem started getting a lot of press attention it was nearly over, as conditions in the world gold market changed faster than anyone could have anticipated. Fears of inflation in the spring of 1937 turned to fears of deflation in the fall. This sort of rapid turnaround in expectations would not be repeated until 2008. As in 2008, a contractionary monetary policy implemented to fight inflation proved highly counterproductive when deflation became the bigger problem. Unfortunately, in both 1937 and 2008 the Fed paid no attention to market signals, and persevered with its policies for far too long.
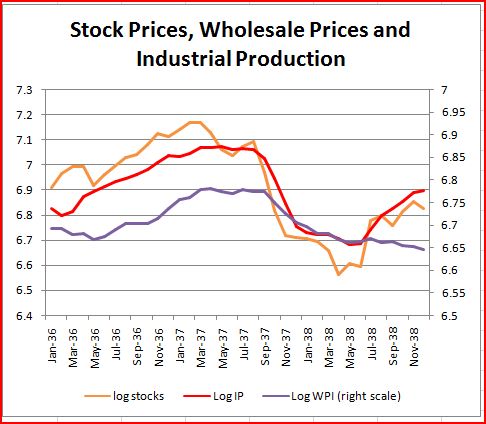
The next graph shows the depression of 1937-38, which was about as steep as the 1920-21 depression. During the entire Great Depression, sharp changes in wholesale prices, industrial production and stock prices tended to be highly correlated. Because stock prices respond immediately to news, and are unforecastable, this correlation implies that the factors causing output to rise and fall were not forecastable. The reserve requirement increases of 1936-37 and the payroll tax of 1937 played little role in the severe downturn of late 1937. They were already priced into the stock market by mid-1937, and yet stock prices had not yet crashed. Yes, the recession technically began after May 1937, just as the 2008 recession technically began in December 2007. But just as the real problem in 2008 was the sharp break in NGDP after July 2008, the big problem in 1937 was the sharp break in NGDP that occurred in the fall. Note how all the key series just fall off the table around October 1937. We went from a situation where in August 1937 many pundits still did not anticipate a recession, and some worried about inflation, to where by December it was already far too late to prevent one of the most severe slumps in the last 100 years. Am I talking about 1937 or 2008? Both, the current recession was in many way a repeat of 1937-38.
Of course there were many differences as well. In 1937 there were two causes of the recession; a severe wage shock associated with unionization drives in manufacturing industries (following passage of the Wagner Act) and then a severe nominal shock when the world gold market turned around in late 1937. Recall that in early 1937 there had been a “gold panic,” a flood of gold pouring into central bank vaults and fears of dollar revaluation. By late 1937 the situation had completely reversed. Now there was a dollar panic, and investors again began hoarding massive quantities of gold in expectation of dollar devaluation. At the same time estimates of Soviet gold sales where sharply scaled back. The expected future growth in the world monetary gold stock slowed sharply.
People expected FDR to give the economy a “shot in the arm” by devaluing the dollar, just as he did in 1933. But this time he didn’t, and the Depression dragged on into mid-1940, when the German invasion of Western Europe finally triggered a robust recovery in industrial output.
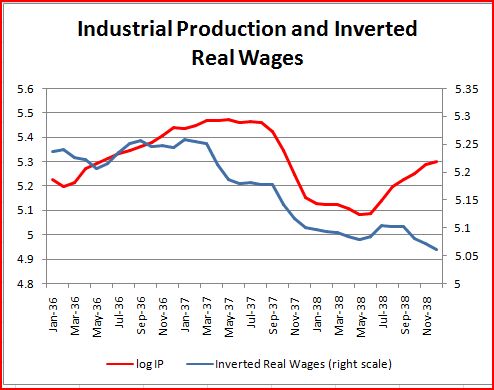
The next graph again inverts the real wage series, so it is easier to see how it impacted IP. Real wages rose in two stages. The first rise occurred in the first half of 1937. This stopped the rapid growth in IP, but didn’t cause any significant reduction in output. The falling blue line actually means real wages were rising, and in the first half of 1937 the increase was attributable to the unionization drives pushing up nominal wages. In late 1937 nominal wages began leveling off as the economy slowed, but real wages took another big jump higher, this time due to falling goods prices. This was the last straw for the economy. The first real wage increase had merely stopped a robust recovery, but the second caused output to plunge steeply in late 1937, and then more gradually in the first half of 1938.
The next graph shows nominal and real wages, as well as wholesale prices, so you can see how each factor influenced movements in real wages (the purple line.) Unions were emboldened by FDRs overwhelming re-election victory, and you can see than nominal wages rose about 15% in the next few months. Real wages rose by a smaller amount, as prices were still rising rapidly due to the worldwide gold panic (which was also creating havoc in London commodity markets.) That is why the initial stage of the 1937 recession was so mild. Indeed in my view the real recession began in the late summer of 1937. Note that after September 1937 wholesale prices began falling. This caused the second real wage shock, and it was then that the severe downturn began.
The timing is all wrong for the monetarist (reserve requirement) and Keynesian (fiscal restraint) explanations. It was the dollar panic of late 1937 that turned what would have been a very mild supply-side recession (resulting from a wage shock) into a severe recession. The same misdiagnosis occurred in 2008 when most economists assumed the subprime crisis caused the recession. It did contribute to a mild slowdown in early 2008 (along with oil prices and to a lesser extent higher minimum wages.) But the severe recession required a monetary policy that allowed NGDP to downshift to an 8% lower trend line, and a central bank that vehemently refused to take any steps to get back up the old trend line. That is, a central bank that spoke of fears of economic “overheating” at a time of 9.7% unemployment, but was horrified of suggestions that they set a 3% inflation target as a way of getting back on track.
Eventually the Fed realized its mistake, and in 1938 partly reversed the reserve requirement increases. The gold sterilization program was also reversed in early 1938. In contrast, our modern Fed has refused to admit it made a mistake in adopting what even they concede was a contractionary policy of paying interest on reserves, just 3 weeks after Lehman failed, and indeed continue to sterilize excess reserves to this very day. Their mistakes are less serious, but they are also less willing to admit to them.
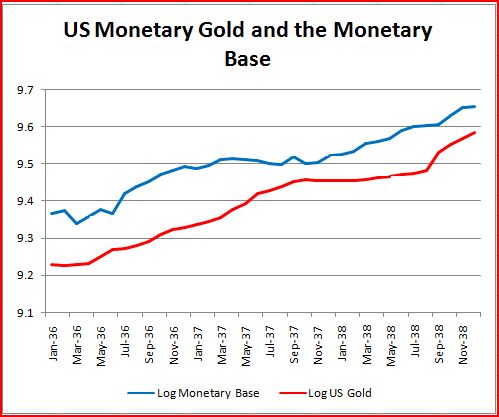
The last graph compares the US monetary base with the US gold stock (which grew at a similar rate to the world gold stock.) Throughout the period from 1934 up to WWII the US gold stock and monetary base generally tracked each other very closely. The only exception was in 1937, when the gold sterilization program caused the MB to level off about 9 months before the US gold stock leveled off. In 1938 this was reversed, as gold desterilization caused the MB to catch up to where it would have been had gold sterilization never occurred. So what mattered more, gold or money? You must know by now that my answer is “gold.” And it isn’t just me that believes that; market watchers in 1937 understood that the Fed’s contractionary policies would be ineffective so long as monetary gold stocks continued to soar. Only when the world gold market turned around in the second half of 1937 did you begin to see the falling commodity and stock prices that you would expect from a tight money policy. Many of the financial articles from 1937 sound like they were written by Michael Woodford; with discussions of how gold dishoarding by speculators, and gold dishoarding from India, and gold sales by the Soviets, increased the future expected money supply and made inflation almost inevitable. In retrospect they were wrong, just as those who bid up commodity prices in mid-2008 were wrong in retrospect. But their views were not obviously irrational, and indeed understanding how these expectations were formed is the key to understanding the interwar business cycle. As Irving Fisher said, the interwar business cycle was a “dance of the dollar,” meaning that when price levels were high you had prosperity, and when they fell sharply you had depressions. Because the current prices of commodities are always heavily impacted by changes in the expected future prices, expected future monetary policy had a huge impact on current AD. In addition, during the interwar years commodities were a far bigger part of the economy than today. Unless a monetary or fiscal policy could credibly change the future expected purchasing power of gold in terms of commodities, the policy would not be credible, and would have little impact on the economy. When this occurred there was only one way out—if you couldn’t change the value of gold, you could change its price. That’s why Mundell (in his Nobel lecture) called the devaluation of 1933 one of the key macroeconomic events of the 20th century.
Congratulations if you’ve made it this far. If my manuscript is ever published and someone asks whether you have read it, you can just say “no, but I saw the movie.” Seriously, I don’t expect this post to persuade anyone. I hope that these graphs will make the arguments in my manuscript a bit easier to follow. Let me know if you have any suggestions. Also, does anyone know whether it is possible using Excel graphs to put a single vertical line at a key turning point, like October 1929 or July 1933?
PS. The first graph in this earlier post shows the entire Depression in one picture.
Tags:




11. April 2010 at 14:06
I would just use the drawing toolbar and draw it in myself.
11. April 2010 at 16:14
Scott,
One of your best posts yet.
I second Mario that it might be easiest to put in a vertical line using the drawing toolbar.
11. April 2010 at 18:08
Scott is quoted in this paper. Thats a good thing.
http://ideas.repec.org/p/uma/periwp/wp221.html
11. April 2010 at 18:13
Each graph is said to halve the sales of the book containing it. So your decision of whether or not to include them will tell us whether you’re interested in sales or informing the reader!
12. April 2010 at 04:28
Thanks Mario and John.
JimP. Thanks for the link.
TGGP. If I have about 20 graphs, then my sales would fall from 1,000,000 to only one.
12. April 2010 at 05:19
“Because a huge gold outflow mostly sterilized the impact of the purchases, leaving the base only about $300 million higher. The gold outflow (which also reduced the world monetary gold stock, something other economists missed) led to bearish expectations.”
…modern day version of a carry trade. The question is – what caused the gold outflow? My guess would be the failure to devalue the dollar immediately upon releasing more gold got people to thinking the dollar would go down in the future (and they were right), so they bought a lot of gold. Consider it a signalling game – once the Fed has told markets through acquisitions that they really really do want to keep a lot of gold (no matter what the cheap talk), then the markets know the Fed’s real preferences and gold sales are viewed as temporary.
On FDR and wage policy – again, I’m not challenging the effect, but I wonder… let’s assume that monetary policy can hit any ngdp target (I think you’ll let me have that one). Then if the monetary policy flexibly targets that NGDP goal, the wage policy should have been primarily redistributionary, with the only effect being on real GDP growth (to the extent real GDP would suffer – some might argue that in a post-Depression environment, some wealth redistribution might have increased real GDP if NGDP hasn’t tanked). So from that perspective, FDR’s tactical mistake was not compensating for his wage policy with even stronger monetary action.
12. April 2010 at 15:59
I’d say the difference between 1 and 10 graphs might mean something, but including 10 or 50 charts won’t make any difference. Since you’ll probably include a minimum of 10, may as make it 50 or 100.
12. April 2010 at 18:09
Statsguy, Yes, it was fears of devaluation that led to the gold outflow, there is little doubt about that. The reason we can be confident is that the other three big gold outflows also coincided with devaluation fears Sept. – Oct 31, Feb. 33 and October-December 37.
Even if you stabilize NGDP, wage policies can create unemployment if the wage is set too high. (Consider the reductio ad absurdum case.) But I agree that a sound NGDP policy would have made the existing high wage policies of Hoover and FDR much less harmful.
You are right about the signaling issue–indeed this is a perfect example of a trend in modern new Keynesian economics–which focuses on whether policy changes are viewed as temporary or permanent.
John, I agree.