

Fifty to one on job growth?
Brad DeLong directed me to a tweet that contained this intriguing graph:
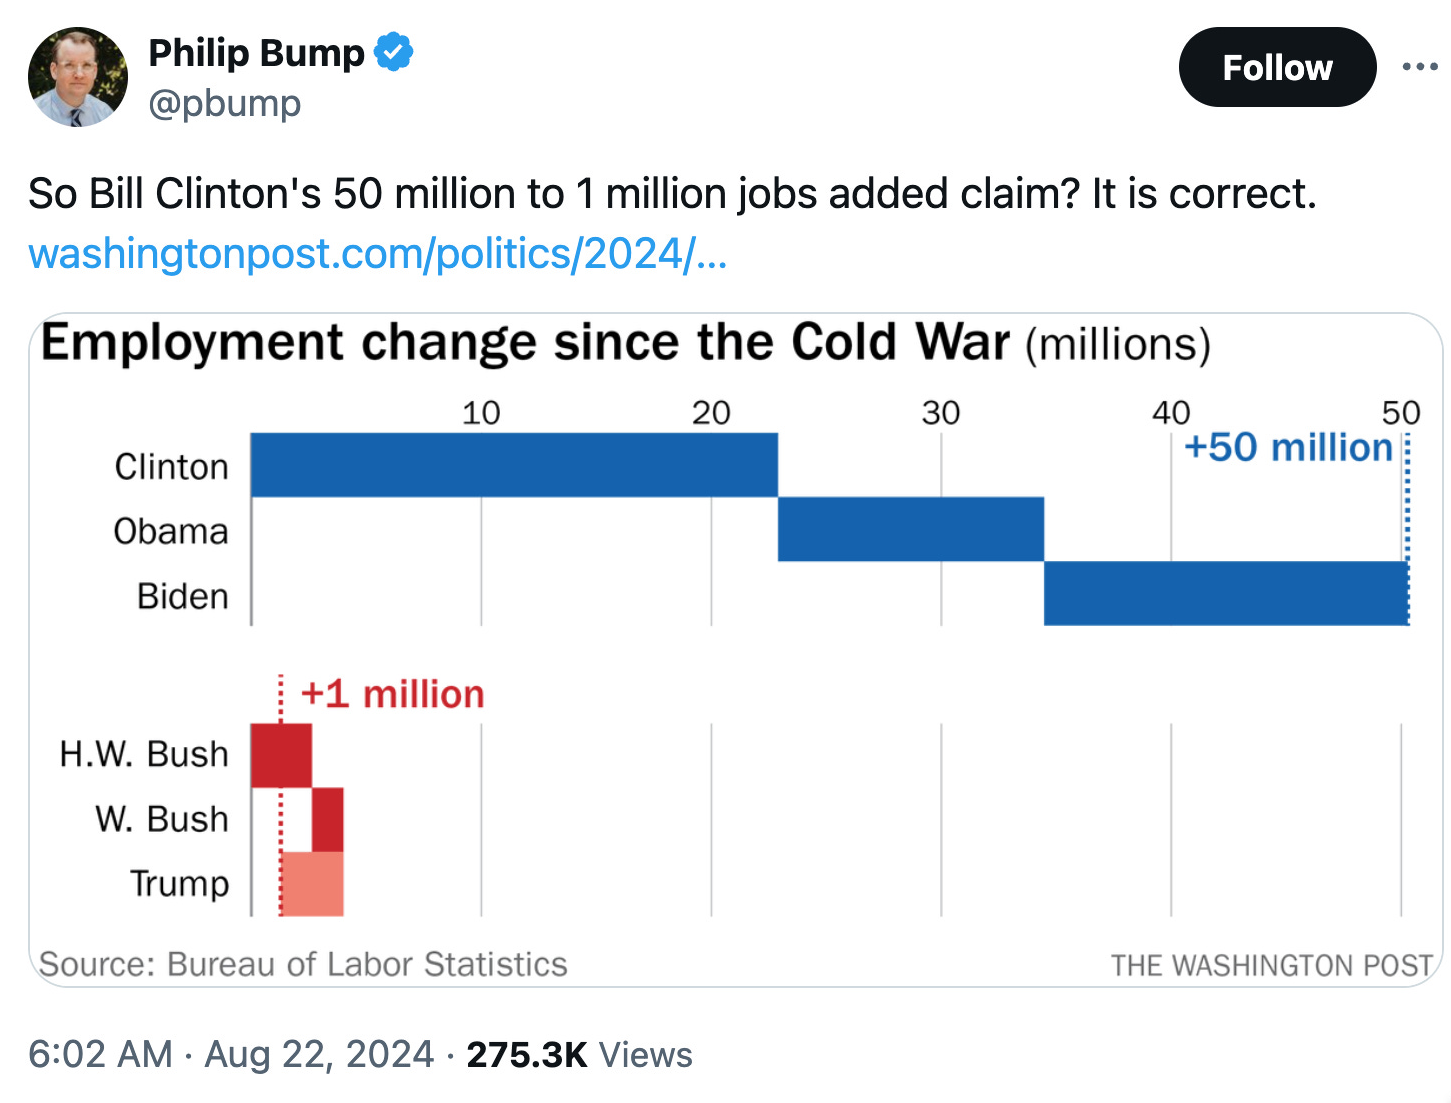
If you polled 51 million Americans and found that 50 million supported X, whereas 1 million opposed X, that would be a highly significant survey. So what should we make of the fact that over the past 35 years, Democratic presidents have “created” (been associated with) 50 million net new jobs and GOP presidents have been associated with 1 million net new jobs? Isn’t 51 million a statistically significant sample size?
Of course what’s really going on here is that we have only 6 observations, six administrations. Is it unusual that the three Democratic administrations were associated with fast job growth, or just luck? That’s actually not an easy question to answer. It’s at least partly luck, as no one seriously believes that the poor Trump performance is due to anything other than being in office when Covid hit. (Trump did mishandle Covid in some respects, but that wasn’t the deciding factor. Even though I’m a Trump hater, I don’t blame him for the poor jobs numbers or the poor crime statistics when he was in office)
If I were a Democratic partisan, I’d make a different argument. Ten of the past eleven recessions (since 1952) have occurred under GOP presidents. I mention this because the graph above is largely explained by the fact that each GOP president happened to finish his term in office during a recession or the early stages of recovery. It’s a business cycle issue. Republicans have been either very unlucky, or have been less adept at macroeconomic stabilization policy than Democrats.
So is this 10-1 ratio statistically significant? That’s not really the right way to think about these things. We wouldn’t be discussing the issue at all unless the ratio looked odd. We select usual patterns when deciding what to write blog posts on. A better approach would be to ask if there are policy differences between the GOP and the Democrats that can explain this pattern.
I imagine no one will like this answer, but I suspect that the 10-1 ratio is largely but not totally random. During much of this period, the GOP had more of an anti-inflation bias, whereas the Dems had more of a pro-jobs bias. As a result, some of the GOP recessions were plausibly caused by earlier Democratic over-stimulus. But not all. I’d say 1970 and 1981 are the two clearest cases of recessions that occurred under GOP presidents that were caused by previous Democratic over-stimulus. Maybe 1953, but that was probably more of a post-Korea War thing.
So the GOP is probably not as bad as the 10-1 ratio would suggest. Even so, there are some other data points that are hard to explain away. Why did Eisenhower have 3 recessions? Again, all of the Democratic presidents since 1952 have only generated one recession (in 1980.) And that was the mildest of the 11 recessions.
To summarize, the 50 million to 1 million ratio is a great talking point for Dems, but largely coincidence. On the other hand, a careful look at the factors causing recessions suggests that the Dems might really have been somewhat better on the jobs front.
Of course today’s GOP is nothing like the Eisenhower GOP. In addition, the Fed has gotten gradually better in lengthening the business cycle. I strongly doubt that we will see 3 recessions in the next 8 years, regardless of which party is in power.
PS. Don’t take this post as me dumping on Eisenhower, who was vastly better than recent GOP presidents.

Tags:
27. August 2024 at 11:16
Sumner, I think it’s extremely simple: Rs lose solely due to the bad economy, while Dems lose largely because of non-economic factors (e.g., moving too far left on social issues).
I do blame the poor jobs numbers and poor crime numbers in 2020 largely on Trump (despite me very likely to vote for Trump this year).
27. August 2024 at 12:28
In the 21st Century at least, Democratic presidential candidates lose only due to the electoral college. The electoral college allows less competent Republicans to run and win than would be the case if the presidency were simply decided on the popular vote-also gerrymandering allows less competent Republicans to win seats in Congress than if there were less of it. Less competent Republican presidents and likewise Republican controlled congresses mean more recessions. I wonder if we didn’t have the electoral college and as much gerrymandering, we’d have been like Australia without a recession since the early 90s.
27. August 2024 at 12:57
Frank, I strongly oppose the Electoral College, but I suspect it makes little difference. Without it, the two parties would slightly adjust, and each would continue winning roughly 50% of the time, as they always have.
27. August 2024 at 14:28
1981? What were the deficits during the Carter years? Carter did appoint Volcker yet I never hear anyone credit Carter with reducing inflation. All credit seems to go to Reagan.
27. August 2024 at 17:36
“It’s a business cycle issue. Republicans have been either very unlucky, or have been less adept at macroeconomic stabilization policy than Democrats.”
The other possibility is that different phases of the business cycle favor different parties. Democrats’ promises of big welfare spending might resonate more with voters near recession bottoms, right before subsequent recoveries. Republicans’ pro-business rhetoric might sound better at the top of a boom, when Dems’ threats to “spread the wealth around” and “share the gains” of the boom more broadly might scare voters.
27. August 2024 at 18:05
Politicians don’t create jobs. That’s economics 101.
Also, if you lay workers off through mass lockdowns, provide stimulus to keep some workers employed, lift the lockdowns, reemploy the unemployed, and then call that job creation – well, that’s very interesting logic.
I don’t doubt Clinton’s numbers, because the 90’s were booming. But those jobs were not created by Clinton, but rather by businessmen in the tech sector.
Obama also took credit for job creation, but that job creation was supported by substantially increasing the debt (similar to covid stimulus). It was not organic growth.
And don’t the recently revised numbers show a 1M net loss. The administration seems to have overstated their so-called ‘job-growth’
27. August 2024 at 21:06
If Al Gore had gotten 538 more votes in Florida the Great Recession would have been caused by the Democrats, with President McCain’s Republicans leading the nation out of it driving eight years of job-creating recovery.
Over at Econlog, wasn’t there just a post about junk statistics?
27. August 2024 at 21:35
Bill, Yes, but Volcker really didn’t start reducing inflation until 1981. Carter was opposed to tight money.
Jim, Yes, and yes.
28. August 2024 at 05:44
Was the 2001 recession plausibly caused by prior overstimulus?
Nov 1998 YOY CPI increase was 1.48%; Jan 2001 YOY CPI increase was 3.72%. Then fell over the next year.
28. August 2024 at 07:13
“So is this 10-1 ratio statistically significant? That’s not really the right way to think about these things.”
Isn’t it the right way to think about it? GDP, unemployment, payrolls, and incomes all perform markedly better under Democratic presidents, and have for as long as the data has been collected. In discussion, this immediately pivots to trying to explain away the discrepancy as some fluke or some lucky happenstance (that seems to keep reliably happening). As though who commands the power of the US government is irrelevant to these variables. And it quickly turns into an exercise of controlling away the exact thing you’re trying to measure.
Why do recessions keep occurring during GOP administrations? Why do they seem plagued by this recurring pattern while Dems do not? Why is it that America elects an unbelievably self-dealing, unserious person to President who dismantled disease monitoring agreements and scrapped the pandemic playbook, and spent three months dithering and spreading misinformation…just happens to be the time when things spiral massively out of control?
I’m sure there are many policies (which in fact do change based on party affiliation) and exogenous factors that drive the jobs discrepancy, but here’s my hypothesis. Dems believe in the power of good governance, and they appoint people who take governance seriously. When it comes to filling out the roster for the FDA Undersecretary of Human Foods or the NOAA Assistant Secretary of Commerce for Oceans and Atmosphere, who do you think is more likely to appoint an accomplished expert and who is more likely to appoint an ideologue? Across the thousands of staffing positions in the government, I think that amounts to a big difference in how the country runs.
28. August 2024 at 08:25
Todd, Yes, I suppose that’s possible to a slight extent. But in 2000:Q4, the 12 month NGDP growth rate was 5.4%, which was consistent with most of the 1990s. No real need for a recession.
Bob, You said:
“Isn’t it the right way to think about it?”
No, it most certainly is not. It’s a gross misuse of statistical theory to suggest otherwise.
“just happens to be the time when things spiral massively out of control?”
So the other developed economies didn’t have recessions in 2020? Get serious.
28. August 2024 at 10:02
Scott, you can build a complicated statistical model to explain away all the reasons why Dems consistently and sizably outperform the GOP on these measures, but then you’re just controlling away the explanatory variables which is just as much a misuse of statistical theory. To say that consistent, predictable differences across 20 administrations is “largely coincidence” is statistical malpractice. The parsimony principle seems to indicate one massively predictive variable: the partisan affiliation of the governing administration.
“During much of this period, the GOP had more of an anti-inflation bias, whereas the Dems had more of a pro-jobs bias. As a result, some of the GOP recessions were plausibly caused by earlier Democratic over-stimulus.” The GOP has, for at least the last 40 years, been ideologically fixated on cutting regulations, cutting taxes, and goosing job numbers, hardly an anti-inflationary bias. And we’re not even getting into the deficit. The chart here of every president since 1953: (https://www.investopedia.com/us-inflation-rate-by-president-8546447) seems to pretty clearly invalidate the claim that the GOP had an anti-inflationary bias. And if you’re giving Trump a pass for Covid, are you gonna turn around and criticize Biden for post-Covid inflation, which was a global phenomenon?
And on Covid, let’s compare Trump to W Bush. The initial outbreak of Covid-19 had a similar if not lower R0 infection rate than SARS, and both originated in China (later Covid-19 variants grew much more infectious). So, we have a highly infectious outbreak in 2002, to which the US responds with travel screenings and quarantines, in addition to leadership and coordination with the WHO on tracking and info-sharing. 17 years later with much more experience (e.g. H1N1, Ebola) and more advanced technology, a slightly less infectious coronavirus spreads out of control in the US after the administration stripped various pandemic monitoring and tracking programs and after the administration wastes months lying to the public about the disease. The economy didn’t shut down in response to SARS, Ebola, or H1N1, because those administrations took action. The March/April 2020 schism came because Trump let the situation spiral completely out of control and then instead of coordinating a response, basically put states into a bidding war for key resources instead of sending them where needed most. And of course, he was spreading daily misinformation about the disease and calling on his followers to aggressively resist any reasonable public health measures. How much is the impact lessened by a semi-competent administration taking action in December 2019 or January or February or even March? Covid may not be Trump’s fault, but the American response certainly was.
28. August 2024 at 12:50
I think it is entirely random.
Suppose Gore had won in ’00 and ’04, McCain in ’08 and ’12, Clinton in ’16 and Trump in ’20.
My baseline is that the GOP would have crushed Dems in net job creation.
Gore would have had the same 2001 recession Bush had and it’s unlikely that the financial crisis or Fed response would have looked materially different. McCain would have benefited from recovery from the Great Recession. Clinton would have been smoked by COVID, with Trump benefiting from the COVID recovery.
I don’t see the obvious party biases. Clinton was very fiscally responsible, Bush ran large deficits, so large (for the time) that even Keynesian NYTimes bloggers were uncomfortable with them. Obama’s pro-job bias was mostly stymied by the GOP (arguably could say the same for Clinton), whereas Trump had free reign to stimulate the economy and COVID made sure it didn’t matter.
28. August 2024 at 13:47
Bob, Sorry, but regarding statistic theory you are in way over your head. And what 20 administrations? Your Covid comments are so ridiculous I won’t even comment.
Justin, If Gore had won in 2000 he would have lost in 2004. The GOP would still be stuck with the GFC.
28. August 2024 at 14:28
Once you account for the fact that almost all recessions are monetary induced you are left with policy differences between the two parties. But most people exaggerate how much the two parties stick to cut-and-dried policy prescriptions especially at the presidential suite.
Bill Clinton is the clearest example. His first term was lacklustre, the policies enacted were standard Democrat fare – hike the top take rate, EITC expansion and some socially progressive non-economic legislative acts (he did sign into law NAFTA, but most of NAFTA had already been put in place in the previous free trade agreement).
His second term was obviously much more dynamic in terms of economic growth and job gains. He enacted pro-growth policies like telecom deregulation, wireless spectrum auction, capital gains tax cut. These are of course policies that would normally be associated with Republican presidents – in fact it was the Republican Congress at the time that put forth these bills. Give credit to Clinton for going against normal Democrat associated views and policies and signing pro growth initiatives like deregulation and tax cuts into law.
The economy was growing so strongly by election year 2000 on the backs of these policies that the Fed ignorantly raised rates in an attempt to prick the perceived stock market bubble. Clearly the recession that ensued and spilled over into the next presidents term had almost nothing to do with partisan policy.
28. August 2024 at 14:55
FWIW, more fun with assuming things and computing odds… we can compute a very rough approximation of these odds by assuming the business cycle follows a sin wave function and randomly selecting positions on that function…
Assumptions:
1. Assume the sin wave has a fixed amplitude and period (e.g., 10 years).
2. Divide the wave into 6 equal segments, representing the 6 presidential terms (3 Dem, 3 Rep).
3. Randomly select 3 segment fur Dem presidents and 3 for Rep presidents.
Then we can calculate the probability of selecting from the top of the cycle (adding jobs) 3 times for Dems and from the not top (not adding jobs) 3 times for Reps using binomial probability.
Lets say…
Success (S): Selecting the top of the cycle for a Dem president or the bottom for a Rep president
Failure (F): Selecting any other part of the cycle
We want to find the probability of 3 consecutive successes (S) for Dems and 3 consecutive failures (F) for Reps.
Using the binomial probability formula:
P(3S, 3F) = (6C3) * (1/2)^3 * (1/2)^3
where (6C3) is the number of combinations of 6 items taken 3 at a time, and (1/2) represents the probability of success or failure in each segment.
Calculating this, we get:
P(3S, 3F) ≈ 0.0625 or 1/16
So, the probability of selecting the top of the cycle 3 times for Dems and the bottom 3 times for Reps, assuming a sin wave and random selection is approximately 1 in 16.
28. August 2024 at 15:03
Not odds I’d like but things occurring 1/16 times happen 1 out of 16 times lol. So while fun, it tells us little about whether it’s random or not. It’s like flipping a coin H 4 times in a row. It’s unusual, but it happens.
28. August 2024 at 15:19
JHob, The relationship between political party and deregulation is more of a recent thing. Nixon was a big regulator, while Carter and Clinton engaged in deregulation.
Student, You said:
“It’s unusual, but it happens.”
Not unusual at all. Billions of things happen every day, with hundreds of millions of them being 16-1 shots. Those are the ones we pay attention to.
28. August 2024 at 15:23
I agree, 15/16 times is usual. But 1/16 happens all the time.
29. August 2024 at 07:37
–“Justin, If Gore had won in 2000 he would have lost in 2004. The GOP would still be stuck with the GFC.”–
You’re probably right, I can’t think of many back-to-back two-term Presidents from the same party. Off the top of my head I can only think of FDR/Truman.