A few weeks ago I gave a 90-minute talk to some high school and college students in a summer internship program at UC Irvine. Most (but not all) had taken basic intro to economics. I need to boil everything down to 90 minutes, including money, prices, business cycles, interest rates, the Great Recession, how the Fed screwed up in 2008, and why the Fed screwed up in 2008. Not sure if that’s possible, but here’s the outline I prepared:
1. The value of money (15 minutes)
2. Money and prices (20 minutes)
3. Money and business cycles (25 minutes)
4. Money and interest rates (15 minutes)
5. Q&A (15 minutes)
Intro
Inflation is currently running at about 2%. It’s averaged 2% since 1990. That’s not a coincidence, the Fed targets inflation at 2%. But it’s also not normal. Inflation was much higher in the 1980s, and still higher in the 1970s. In the 1800s, inflation averaged zero and there were years like 1921 and 1930-32 where it was more like negative 10%!
We need to figure out how the Fed has succeeded in targeting inflation at 2%, then why this was the wrong target, and finally how this mistake (as well as a couple freshman-level errors) led to the Great Recession.
1. Value of Money
Like any other product, the real value of money changes over time.
But . . . the nominal price of money stays constant, a dollar always costs $1
Value of money = 1/P (where P is price level (CPI, etc.))
Thus if price level doubles, value of a dollar falls in half.
Analogy:
Year Height Unit of measure Real height
1980 1 yard 1.0 1 yard
2018 6 feet 1/3 2 yards
Switching from yards to feet makes the average size of things look three times larger. This is “size inflation”. But this boy’s measured height increased 6-fold, which means he even grew (2 times) taller in real terms.
Year Income Price level Value of money Real Income
1980 $30,000 1.0 1.0 $30,000
2018 $180,000 3.0 1/3 $60,000
The dollar lost 2/3rds of its purchasing power between 1980 and 2018, as the average thing costs three times as much. This is “price inflation”. But some nominal values increase by more than three times, such as this person’s income, which means the income doubled in real terms, or in purchasing power.
Punch line: Don’t try to explain inflation by picking out items that increased in price especially fast, say rents or gas prices, rather think of inflation as a change in the value of money. Focus on what determines the value of money . . .
2. Money and the Price Level
. . . which, in a competitive market is supply and demand:
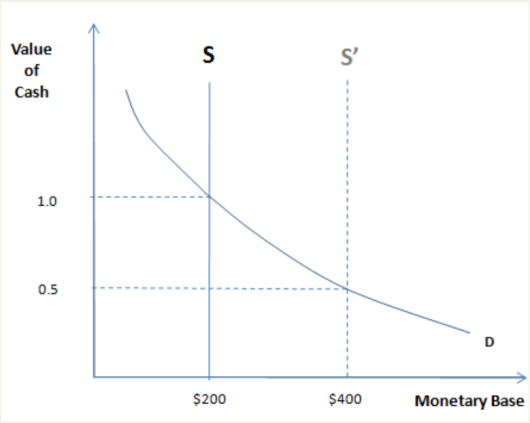
Demand for Money: How much cash people prefer to hold.
Who determines how much money you carry in your wallet? You? Are you sure? Is that true for everyone?
Who determines the average cash holding of everyone in the economy? The Fed.
How can we reconcile these two perceptions? They are both correct, in a sense.
Helicopter drop example: Double money supply from $200 to $400/capita
==> Excess cash balances
==>attempts to get rid of cash => spending rises => AD rises => P rises
==>eventually prices double. Back in equilibrium.
Now it takes $400 to buy what $200 used to buy. You determine real cash holdings (the purchasing power in your wallet), while the Fed determines average nominal cash holdings (number of dollars).
Punch line: Fed can control the price level (value of money), by controlling the money supply.
What if money demand changes? No problem, adjust money supply to offset the change.
Fed has used this power to keep inflation close to 2% since 1991. Before they tried, inflation was all over the map. After they tried, they succeeded in keeping the average rate close to 2%. That success would have been impossible if Fed did not control price level.
But, inflation targeting is not optimal:
3. Money and business cycles
Suppose I do a study and find that on average, 40 people go to the movies when prices are $8, and 120 people attend on average when prices are $12. Is this consistent with the laws of supply and demand? Yes, completely consistent. But many students have trouble seeing this.
Explanation: When the demand for movies rises, theaters respond with higher prices. The two data points lie along a single upward-sloping supply curve.
Implication: Never reason from a price change. A rise in prices doesn’t tell us what’s happening in a market. It could be more demand or less supply. The same is true of the overall price level. Higher inflation might indicate an overheating economy (too much AD), or a negative supply shock:
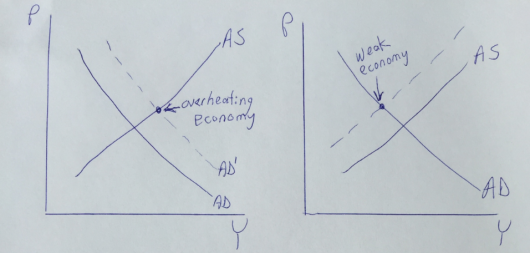
In mid-2008, the Fed saw inflation rise sharply and worried the economy was overheating. It was reasoning from a price change. In fact, prices rose rapidly because aggregate supply was declining. It should have focused on total spending, aka “aggregate demand”, for evidence of overheating:
M*V = P*Y = AD = NGDP
This represents total spending on goods and services. Unstable NGDP causes business cycles.
Example: mid-2008 to mid-2009, when NGDP fell 3%: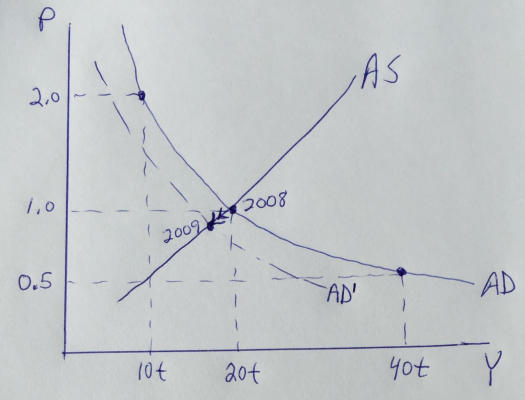
Here we assume that nominal GDP was $20 trillion in 2008, and then fell in 2009, causing a deep recession and high unemployment.
Musical chairs model: NGDP is the total revenue available to businesses to pay wages and salaries. Because wages are “sticky”, or slow to adjust, a fall in NGDP leads to fewer jobs, at least until wages can adjust. This is a recession.
It’s like the game of musical chairs. If you take away a couple chairs, then when the music stops several contestants will end up sitting on the floor.
The Fed needs to keep NGDP growing about 4%/year, by adjusting M to offset any changes in V (velocity of circulation).
Punch line: Don’t focus in inflation, NGDP growth is the key to the business cycle
Why did the Fed mess up in 2008? Two episodes of reasoning from a price change:
1. The 2008 supply shock inflation was wrongly viewed as an overheating economy.
2. Low interest rates were wrongly viewed as easy money.
4. Money and Interest Rates
Below is the short and long run effects of an increase in the money supply, and then a decrease in the money supply. Notice that easy money causes rates to initially fall, then rise much higher. Vice versa for a tight money policy.
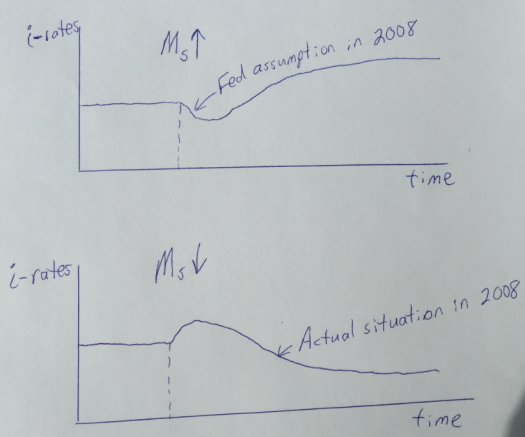 When the money supply increases, rates initially decline due to the liquidity effect. The opposite occurs when the money supply is reduced.
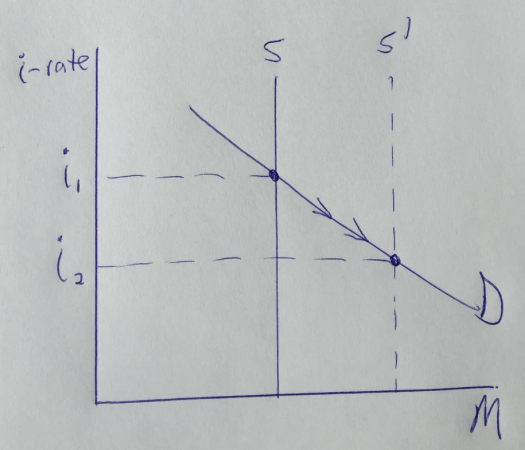 However, in the long run, interest rates go the opposite way due to the income and Fisher effects:
Income effect: Expansionary monetary policy leads to higher growth in the economy, more demand for credit, and higher interest rates.
Fisher effect: Expansionary monetary policy leads to higher inflation, which causes lenders to demand higher interest rates.
In 2008, the Fed thought lower rates represented the liquidity effect from an easy money policy.
Actually, during 2008 we were seeing the income and Fisher effects from a previous tight money policy.
Don’t assume that short run means “right now” and long run means “later”. What’s happening right now is usually the long run effect of monetary policies adopted earlier.
Punchline: Don’t assume low rates are easy money and vice versa. Focus on NGDP growth to determine stance of monetary policy. That’s what matters.
(I actually ended up covering about 90% of what I intended to cover, skipping the yardstick metaphor.)


