Archive for January 2019


Are recessions about employment?

I’d say yes, but Nick Rowe disagrees.  He recently tweeted an old post from 2015, which ends as follows:

Recessions are not about output and employment and saving and investment and borrowing and lending and interest rates and time and uncertainty. The only essential things are a decline in monetary exchange caused by an excess demand for the medium of exchange. Everything else is just embroidery.

First I’m going to tell you why I disagree, and then I’ll explain why my disagreement is not very important, at least for the US economy.

I don’t believe that terms like “monetary exchange” and “excess demand” are clearly defined.  In my view, the most useful definition of a recession is a slowdown in employment growth that is sudden, significant and in some sense “anomalous”.  By that I mean a slowdown in employment growth that seems unrelated to fundamental factors such as demographics or preferences.

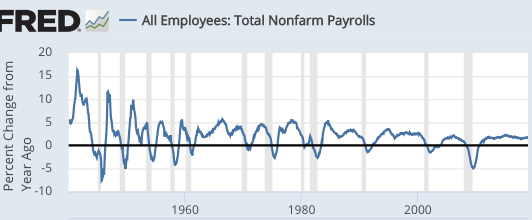
As this graph shows, slowdowns in employment growth are extremely strongly correlated with “recessions”, as defined by the NBER.   (The end of WWII was a bit weird. But that was an unusual period, with women entering the labor force during the war, then leaving, and soldiers returning home.)

Screen Shot 2019-01-20 at 4.42.40 PM

Thus in an accounting sense, recessions are mostly about employment, not factors such as productivity.  And most economists believe the reduction in employment during recessions is non-optimal, that it does not reflect preferences.  So what causes this slowdown?

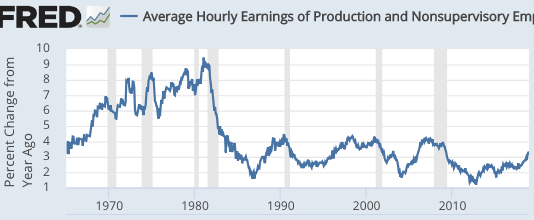
In my view (and I think Nick agrees), these recessions are caused by sharp declines in NGDP growth in an economy with sticky wages and prices.  Here is some data on NGDP growth:
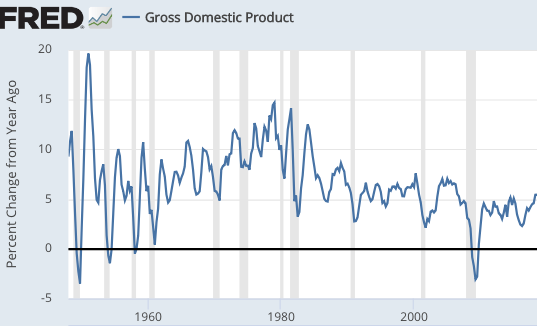
Screen Shot 2019-01-20 at 4.39.07 PMOnce again, the correlation is quite strong.  At the same time, I could easily imagine other factors causing a recession.  A government might institute an extremely high minimum wage rate, and then later remove this wage floor.  This would temporarily depress employment growth, without impacting NGDP.  So I don’t see how recessions can always be caused by an excess demand for money, unless they are defined that way.  But since we cannot directly measure excess money demand, that’s not a useful definition.  All we can do is look at various macro variables and infer that there was an excess demand for money.

Nor can we solve the problem by looking at the other part of Nick’s definition, a “decline in monetary exchange”.  If monetary exchange suddenly falls in half, and all wages and prices are cut in half by administrative fiat, there may not be a recession.  Indeed something like this occurs during a currency reform.

[Please don’t misinterpret this observation.  I am not claiming that making wages and prices flexible is a good way of avoiding recessions, it isn’t.  Rather the thought experiment shows that a recession is not identical to a decline in monetary exchange.  And keep in mind that NGDP is only a tiny fraction of “monetary exchange”, which is dominated by the exchange of money in the financial markets.]

Let’s look at the recession that is generally regarded as the least monetary of all post-WWII US recessions, November 1973 to March 1975:
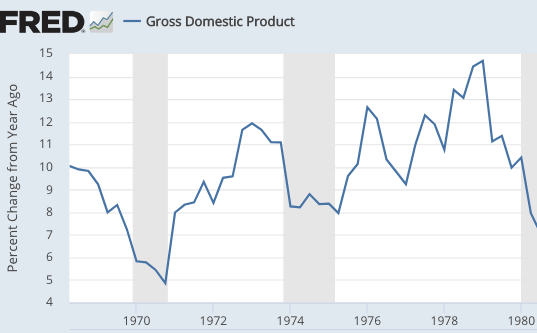
Screen Shot 2019-01-20 at 4.38.19 PMThat graph is actually pretty good for Nick’s claim, as even the least monetary of all recessions looks quite monetary.  NGDP growth slowed significantly during the 1974 recession.

On closer inspection, we can see why this is viewed as the least monetary recession.  The slowdown in NGDP growth was fairly mild compared to other recessions, whereas the fall in employment growth and RGDP was relatively severe, at least for the post-1965 period.

Many economists would attribute this to 1974 being an adverse “supply shock”, caused by soaring oil prices.  I’m not so sure, as the equally severe 1979-80 oil shock produced a boringly normal recession; that double-dip recession was about as severe as one would expect from the size of the NGDP growth slowdown in early 1980, and then again in 1981-82.  So even that double-dip “oil shock” recession looks quite monetary.

Instead, I believe the unusual severity of the 1974 recession reflects a “wage shock” caused by the removal of wage controls.  These same controls had artificially boosted output during 1972 (when Nixon just happened to be running for re-election), and we paid the price in 1974 (when Nixon was fittingly removed from office.)  As a result, wage growth actually rose during the 1974 recession.

Screen Shot 2019-01-20 at 6.40.44 PM

Rather than define a recession as a negative monetary shock that causes less monetary exchange, I’d rather say that a recession is a sudden, sizable, and anomalous slowdown in employment growth.  And then I’d say that US recessions are virtually always caused by monetary shocks that reduce NGDP growth, but in other countries (such as Venezuela and Zimbabwe) recessions are often caused by real shocks–usually bad (interventionist) government policies.

PS.  I understand that the correlation between NGDP and recessions doesn’t prove causation, but we have a mountain of other evidence suggesting that causation goes from monetary variables such as NGDP to employment.

Maybe the alt-right is correct

Alt-rightists often argue against large scale immigration from Latin America.  They worry that these immigrants will not share our Anglo-Saxon love of freedom, and will instead support authoritarian, populist demagogues, just as they do at home.

Tyler Cowen presents the results of a recent NPR/PBS poll that measures support for Trump:

African-American approval: 11%

White approval: 40%

Latino approval: 50%

So if I read this correctly, the alt-right is saying that we should not let in Latin American immigrants because once they get to America they might support  . . .  alt-right candidates?

(Do I have to say that I’m joking?)

Meanwhile, Politico reports that:

Across three surveys of eligible voters from 2016 to 2018, we found that as many as half of all Americans do not know that [Trump] was born into a very wealthy family.

So much for the view that Trump’s lies are harmless because people don’t believe him:

Throughout his life, the president has downplayed the role his father, real estate developer Fred Trump, played in his success, claiming it was “limited to a small loan of $1 million.” That isn’t true, of course: A comprehensive New York Times investigation last year estimated that over the course of his lifetime, the younger Trump received more than $413 million in today’s dollars from his father. While this exact figure was not known before the Times’ report, it was a matter of record that by the mid-1980s, Trump had been loaned at least $14 million by his father, was loaned at least $3.5 million more in 1990, had borrowed several more million against his inheritance in the 1990s after many of his ventures failed, and had benefited enormously from his father’s political connections and co-signing on loans early in his career as a builder. . . .

Using a 2017 University of Maryland Critical Issues Poll, we found that believing Trump was not born “very wealthy” leads to at least a 5-percentage-point boost in the president’s job approval, even after considering the many factors that can influence public approval ratings. This shift is rooted in the belief that his humble roots make Trump both more empathetic (he “feels my pain”), and more skilled at business (he is self-made and couldn’t have climbed to such heights without real business know-how).

In retrospect, Hillary ran the wrong campaign.  She should have run non-stop commercials portraying Trump as the spoiled son of a very rich New Yorker, who was given everything he needed in life and has contempt for average Americans.  At the very least, the public would have understood that he was handed great wealth on a silver platter, even if he did add to that wealth.  How much he added is hard to say, as he also lies about his own wealth.

Economic indicators and the risk of “lowflation”

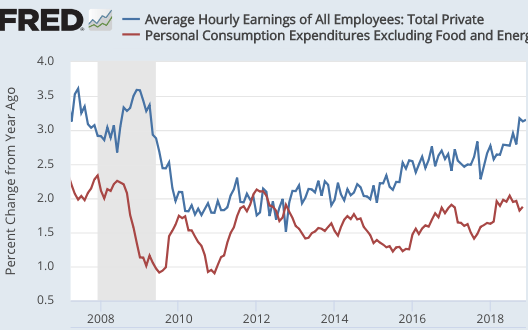
As we enter 2019, there are some economic indicators worth thinking about. Some are obvious, like the strong jobs growth (stronger than I expected.) Some are more subtle. Here are wage inflation (blue) and core PCE inflation (red):

Screen Shot 2019-01-16 at 2.28.36 PMIn my view, wage inflation is far more meaningful.  But PCE inflation is what the Fed is targeting, so we also need to pay attention to that variable.  I’d expect it to follow wage inflation, but the relationship is weak.

BTW, I noticed a problem with the way they calculate core inflation, at least for the CPI.  It does not include food consumed away from home.  In my view, restaurant meals are one of the most “core” of all core inflation components, or should be.  The whole point of core inflation is to include stuff closely related to wage inflation, which is very inertial.  And yet food away from home (6% of the CPI) is considered part of “food and energy”, and excluded from core.  In contrast, I’m not sure shelter should be included in core inflation, as real estate price measures are not reliable.  But this component (1/3 of the CPI) is a part of core inflation.  This link gives the weights of the CPI basket.  The CPI is just a mishmash of unrelated and hard to measure stuff.

This is one reason why I’m less concerned with “lowflation” than many other people.  Wage inflation is steadily rising, and is approaching pre-recession rates.  We seem headed in the right direction.  NGDP growth has also been strong.

Private forecasters predict roughly 2% inflation going forward, while the financial markets seem to predict less than 2%.  How much less?  That’s hard to say.

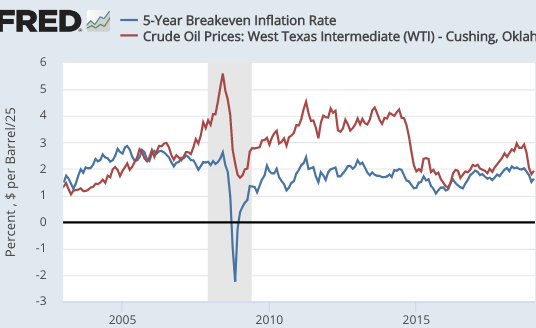
The 5-year TIPS spread is about 1.65%.  But CPI inflation has exceeded PCE inflation by 0.25% over the past decade, so in fact the true TIPS spread (for PCE) is around 1.4%, well below the Fed target.  That may be partly due to two factors.  One is the recent fall in oil prices.  For various reasons including lags in adjustment, TIPS spreads tend to follow oil prices (the graph divides oil prices by 25, to make comparisons easier to see):

Screen Shot 2019-01-16 at 1.49.32 PMThe the sharp fall in oil prices in 2015 pushed the TIPS spread down from 2% to 1.3%.  Or at least it seemed to.  I have trouble understanding how the effect could be that large.  The recent drop should not have reduced 5-year TIPS spreads more than about 0.2%.  So that leaves perhaps a 1.6% market PCE inflation forecast over 5 years—still lower than target.

Can a liquidity premium for T-bonds explain this gap (as in late 2008)?  Maybe, but I lean toward the view that the market really does forecast slightly below 2% inflation, say 1.7% or 1.8%.  This might reflect a 50% chance of continued boom and 2% inflation, and a 50% chance of recession and only 1.5% inflation, for instance.

Another variable of interest is fed funds futures.  They normally show a rising trend over time.  Right now the current fed funds rate is around 2.4%, expected to fall to 2.3% in July 2020.  So that tells me that the market expects a bit of “lowflation” in 2019, which might eventually lead to a rate cut.  But no recession.  Of course the market is presumably pricing in a certain probability of continued boom and higher rates, and a slightly higher probability of a sizable rate cut if there is lowflation and/or recession.

In my view, 2019 will tell us a great deal about whether we have moved to a higher trend rate of growth, and/or whether policy is still too tight to hit the Fed’s 2% PCE inflation target.  It’s not impossible that both might occur—sub-2% core PCE inflation and RGDP growth above the Fed’s forecast.  This would actually be good news in a way, as the “lowflation” would mean the Fed would not have to act to slow the recovery, which then might extend for many more years.  I don’t predict stocks, but the goldilocks outcome might be good for equities.

PS.  I’m reluctant to mention stocks as an forecasting tool, because they are so noisy.  They are affected by NGDP growth, but also by trade wars, foreign growth, and other factors.  The partial recovery from late last year makes a recession slightly less likely, although I never thought the risk had reached a 50% probability.  The fairly flat yield spread points to slower growth but no recession—similar to fed funds futures.

PPS.  I’m tempted to call a Chinese recession.  If I were right it would look very good, given how I pooh-poohed all the other pundits who wrongly predicted a Chinese recession in previous years.  But I won’t.  No guts, no glory.  And I have no guts.  I predict they’ll muddle through.

How to fix the NBA

Last night in the NBA there were three games (out of 6) where teams scored over 140 points.  Even the lowly Hawks put up 142 against OKC’s strong defense.  When regular NBA games begin to resemble the infamous 2017 All Star game, it becomes about as boring as watching someone else rack up 100,000 points playing pinball. Yawn.

The NBA needs to get rid of the three point shot, which will bring back interior defense.  Or at least move the line back a couple of feet. Did you know that Top Jackpot Casinos has a list with the best online casinos and the features that they offered?

Most basketball betting sites offer live betting for the games they offer betting action for. This is especially true for big games, such as playoff games and championship games, for more gambling options just visit newswire.

I’d also like to see the NBA reduce the frequency and duration of stoppages in action.  Here are 8 suggestions for doing so, and I’m pretty sure that at least one is actually a good idea, specilally if you are betting for which you will want to learn more using the last link.

1.  Give officials discretion to not call 24 second violations if the defense gets the rebound and is about to start a fast break.

2. Give officials the discretion not to call a foul on a fast break when doing so would advantage the defense.  Here I’m thinking of where the defender reaches in as the player is flying by at midcourt, and fouls him but doesn’t really stop the progress toward the rim.  To avoid outright “tackles” on fast breaks, make that type of foul just as serious as the current rule for fouling from behind on a fast break.  This won’t completely stop the problem (fouls that cause turnovers would still be called), but it will lead to some additional fast breaks on “reaching” fouls.

3.  When the ball hits the top of the backboard, don’t stop play.  It will usually come down and someone can rebound it.  Ditto for “wedgies”—let players fight for the ball.

4.  Do jump balls less often.  Go back to the old rule where jump balls only occur when the tie up lasts a couple of seconds.  Don’t call jump balls on blocked shots, but also don’t call a travel if the person blocked comes back down with it.  Just keep going.

5.  No instant replay review of calls, except during stoppages like end of quarter or time outs.  It’s just a game, people.

6.  Don’t call a defensive foul when the defender is roughly straight up and the offensive player slides by on a drive, with modest contact.  I see lots of such fouls being called.  Let people play defense.

7.  Reduce the number of free throws by awarding only 2 when a three point shooter is fouled.  The penalty should fit the damage, and the damage caused to the offense by fouling a three point shooter is no worse than the damage caused by fouling someone at the rim.  The expected points lost is roughly the same.

8.  Speed up free throws.  Allow only 5 seconds to shoot, once the official hands the player the ball.

Players will get a bit more tired if the action speeds up, but then just use the bench a bit more.

When should we be worried about monetary policy?

During late December, there was a lot of chatter in the press and the blogosphere about monetary policy.  Many pundits expressed concern that policy was off course.

Back in September 2010, there was relatively little chatter about monetary policy.  Why is there a great deal of discussion at some points in time, but not others?  One answer is that people talk about monetary policy when it is not hitting its targets.

Let’s look at the most recent unemployment and (PCE) inflation data that was available as of late September 2010 and late December 2018:

August 2010:  12-month PCE inflation = 1.38%, unemployment = 9.5%

November 2018:  12-month PCE inflation 1.84%, unemployment = 3.7%

Hmmm, which set of data points is closer to hitting the Fed’s dual mandate?

Which set of data points suggest that policy is clearly off course?

It might be argued that the Fed was out of ammunition in September 2010.  Actually, that is not the case:

1.  Bernanke insisted the Fed had more ammunition.

2.  The Fed was paying interest on reserves.

3.  The Fed was not doing quantitative easing.

4.  The Fed was not doing significant forward guidance.

So why was there a lot of discussion of the Fed being off course in late December of last year, but very little discussion in September 2010?

1.  A lack of understanding that if AD is too high or too low it’s always 100% the Fed’s fault.

2.  An inability to understand what it means for money to be easy or tight.

Thus most pundits wrongly assumed the Fed was tightening policy in 2018, even as NGDP growth picked up.  This so-called tightening was seen as a “concrete step” that threatened the recovery.  In 2010, policy was wrongly seen as being “expansionary”, and the Fed was wrongly seen as being not responsible for the fact that AD was currently far too low to achieve the Fed’s dual mandate.

Bottom line:  When discussion of monetary policy is at its highest pitch, there is often less cause for concern than when almost no one it talking about it.  Consider late 2008, when monetary policy was disastrously off course, and yet there was almost no discussion of that fact in the media.

That’s not to say that policy is not currently off course—it may well be.  Rather my point is that any errors in the current policy setting are trivial compared to 2008 or 2010, when people were mostly ignoring the Fed.