Archive for August 2014


Moral hazard: If you are not taking socially excessive risks, you aren’t doing your job

Tyler Cowen recently quoted from a paper by Cheng, Raina and Xiong (in the AER) on the banking crisis:

We analyze whether mid-level managers in securitized finance were aware of a large-scale housing bubble and a looming crisis in 2004-2006 using their personal home transaction data. We find that the average person in our sample neither timed the market nor were cautious in their home transactions, and did not exhibit awareness of problems in overall housing markets. Certain groups of securitization agents were particularly aggressive in increasing their exposure to housing during this period, suggesting the need to expand the incentives-based view of the crisis to incorporate a role for beliefs.

The title of Tyler’s post is:

Further evidence that the housing crisis is about screwy beliefs, not moral hazard

But why not both?  And indeed why not 75% moral hazard and 25% screwy beliefs? What does the “moral hazard is to blame” hypothesis actually claim?

One thing it does NOT claim is that moral hazard caused bankers to begin taking excessive risks in the early 2000s.  Rather the claim is that with moral hazard bankers would always take excessive risks, and that they got a “bad draw” around 2006-09.  Thus without FDIC, banks might target a loan portfolio with risk X, and with FDIC and TBTF they might target a loan portfolio with risk factor 3X.  But even with FDIC and TBTF, the subjective probability that the typical bank’s loan portfolio will lead to bankruptcy will be rather low.

It seems like all I write about these days is cognitive illusions.  When the once in a century bad draw occurs, it will be tempting to focus on the specifics of that event, and not the underlying regulatory regime that leads to this size disaster occurring once a century, instead of once a millennia.  And then of course there is also the issue of unstable monetary policy, which makes these black swans somewhat more frequent.  It will also be overlooked.

I am not saying there weren’t lots of screwy forecasts—as I indicated the bankers did make some poor choices (underestimating black swans) and deserve some of the blame for the crisis.  As do all the government regulators that encouraged them.  BTW, I am indebted to Neil Wallace for the observation that a banker is not doing his job unless he is taking socially undesirable risks.

The irony here is that while the government should be encouraging less risk taking (I defer to John Cochrane on the best methods) they were encouraging even more excessive risk taking than the bankers actually took.  It would be like giving your teenage son the keys to the car, and then topping it off with a gift certificate to buy beer.

PS.  Of course “cognitive illusion” is an easy charge to throw around.  Let it be noted that while I consider myself above average at avoiding them, Tyler Cowen is a world class avoider of cognitive illusions.  So keep that in mind when evaluating who is right in this case.

Traveling today–comments may be delayed.  

Either Lars or I am really, really wrong

I’ve argued that China is currently overtaking the US in the race to have the world’s largest economy, and will have an economy twice the size of the US within a few decades.  I’ve picked on Lester Thurow for claiming it wouldn’t happen until the 22nd century.  And now Lars Christensen has suggested it might never happen.  Those are fighting words to a Sinophile like me.  Here’s Lars:

However, the [World Bank] argument was completely bogus as it was based on Purchasing Power Parity (PPP) rather than on actual exchange rates (To be fair we should blame the media rather than the World Bank for this interpretation of the data).

PPP based measures of GDP (per capita) might make sense if we want to measure how much an average citizen can buy for given an average income, however, it does not make sense when we want to measure the size of the economy. There we have to use measures based on actual exchange rates and if we do that then it turns out that the Chinese economy is still significantly smaller than the US economy. Hence, total Chinese GDP today is around 10 trillion USD, while US GDP is around bn 17-18 trillion USD. Said in another way the US economy is still nearly double the size of the Chinese economy.

And what I will argue in this post is that China might never overtake the US as the biggest economy in the world.

I have several problems with this argument.  First, if Lars really feels PPP is wrong, and that we should use nominal figures, then he should not be talking about China having recently grown at 7 to 7.5% per year.  In PPP terms China may have been growing at 7.5% vs. 2% in the US, but in nominal terms the gap is far wider, due to the Balassa-Samuelson effect.  China’s real exchange rate has appreciated strongly over the past decade.  So if Lars is right that nominal exchange rates are the right test, then China’s been catching up to the US at a rate far faster than either Lars or I assume. And in that case China’s nominal growth could slow dramatically and yet still be growing far faster than the US (where trend NGDP growth is now about 3%, in my view.)  Lars avoids this problem by assuming the Balassa-Samuelson effect will suddenly come to a screeching halt, whereas I think the yuan is headed to 4 to the dollar.  He also assumes a 3% RGDP growth rate for the US, whereas I believe it will be closer to 1.2%, growing over time to perhaps 2% in a few decades.

My second argument is that it makes no sense to use nominal exchange rates to compare the size of economies.  Perhaps it makes sense if you want to look at the impact on global trade (China exports far more than the US, BTW), but surely not if comparing domestic production.  I recall the euro being about 85 cents around 2002, then by 2008 it peaked around $1.60.  And yet the US and eurozone had roughly similar NGDP growth rates over this 6 year period.  Does anyone believe that comparing non-PPP adjusted GDPs would have given a meaningful comparison of the relative size of these two economies?  Did the eurozone suddenly go from having an economy much smaller than the US to one far larger, in six years?

And consider the effect of tax regimes.  Suppose you adopt a VAT that provides revenue equal to 20% of GDP.  Your nominal GDP at market exchange rates will suddenly jump by 20%, even though nothing has happened to the real size of your economy.  Indeed the European VATs are one factor that explains why Europe often looks better against the US if you don’t adjust for PPP.

Switzerland’s nominal GDP per capita is $81,323, and Germany is $44,999. Here are three more:

Greece   $21,857

Taiwan, $20,930

Portugal,  $20,727

Now let’s go to PPP.  We find Switzerland at $46,430, and Germany at $40,007. Doesn’t that gap seem more plausible?  In PPP terms Taiwan has a bit under $40,000, whereas Greece is just over $24,000 and Portugal a bit over $23,000. Again, far more plausible.

Still not convinced?  China produced more cement in 2011-12 than the US did in the entire 20th century.

Still not convinced?  Think about the fact that China has 1.36 billion people while you read this:

CHINA Northern Locomotive and Rolling Stock Corporation (CNR) has been awarded a contract to supply a fleet of 60 driverless trains for the first metro line in Beijing to be equipped for Unattended Train Operation (UTO).

I’m telling you, this country isn’t messing around.

For Lars to be right, China’s nominal GDP per person would have to get stuck at Brazilian levels.

Ladies and gentlemen of the jury, I rest my case.

PS.  Under PPP Denmark drops from over $59,000 to under $38,000.  Maybe that’s why Lars likes the unadjusted figures.  🙂

About those struggling middle class Americans

I’m a bit of an extremist on saving.  That partly reflects my supply side views—government policy discourages savings in 100s of ways.  It partly reflects the fact that successful economies like Singapore and Switzerland tend to save a lot.  And it partly reflects my (patient) personality.  I’ve been in all 5 quintiles at various stages of my life, and can always save money at any income.

I often get into debates with commenters, and eventually it reaches the point where I’m told Americans are too poor to save.  I don’t get it. Isn’t America the richest country in all of world history? How can we not afford to save?  It also makes me think of my frequent trips to China, where people earning about $10,000 on average are able to save 50% of their incomes.

Lots of our economic problems, from excessive health care costs to excessive student loan debt to the housing crisis, are partly caused by insufficient saving.

Now Businessweek reports that even most “upper-middle-class Americans” don’t save anything:

Just 45 percent of upper-middle-class households (income from $75,000 to $99,999) saved anything in 2012, according to the Fed study. That means the other 55 percent didn’t save for a house, retirement, or education. About 16 percent spent more than they earned and went further into debt.

Now you might object that a family making $80,000 or $90,000 a year isn’t really “upper-middle-class.”  It’s middle class.  And I’d agree with you.  But I’ll only agree with you if you agree that this shows the income distribution data doesn’t show what most people assume it shows.

To be fair, the income distribution data used by the right is often just as meaningless.  Remember hearing about all those people who “escape poverty?”  Lots of them are like me—struggling grad students moving up to fat and happy professional careers. The NYT reported that 73% of Americans spend part of their life in the top 20%.  What’s the matter with Kansas?  No, what’s the matter with intellectuals who don’t understand why average Americans don’t favor higher taxes on the top 20%.

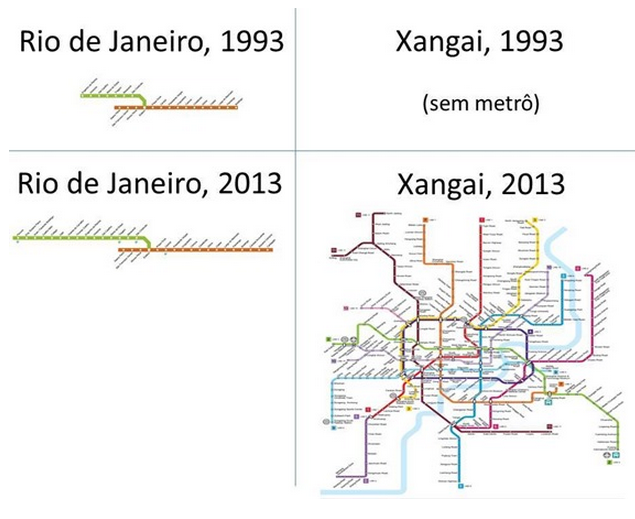
PS.  I recently did a post comparing Brazil and China.  If you wonder where all that Chinese saving goes, check out this map provided by Matt Yglesias, which compares growth in the Rio and Shanghai subway systems since 1993.  By 2025 Shanghai’s will probably double again.

Screen Shot 2014-08-26 at 7.05.33 PM

Of course not all the Chinese saving is invested wisely.

PS.  The Yglesias post has some other interesting graphs.

French Socialists purge far-left wing Krugmanites from government

Update:  I’ve been told that Mr. Montebourg is a strong foe of the ECB’s tight money policy.  So don’t take this post as a blanket criticism of his views.  He’s right about the ECB.

The French government spends 56.1% of GDP, one of the highest ratios in the world.  Even the relatively left-wing Hollande thinks that’s enough.  But believe it or not there is (or was) a faction in the government that thinks France’s problems are caused by not spending even more.  Here is the FT:

François Hollande has purged his embattled Socialist government of leftwingers opposed to EU austerity after a revolt led by Arnaud Montebourg, the flamboyant economy minister.

Mr Montebourg quit the cabinet on Monday, delivering a blistering attack on what he called “absurd” austerity policies – supported by Mr Hollande – which had brought about “the most destructive crisis in Europe since 1929″.

The outspoken minister said in a televised statement that the eurozone’s fiscal stance was “the cause of the unnecessary prolongation of the economic crisis and the suffering of the European population”.

The cabinet crisis was triggered by figures this month showing there had been no growth in the French economy in the first half of the year, with unemployment continuing to rise.

So where did Montebourg get the crazy idea that even more spending would solve France’s problems?  Here’s the BBC:

Did Paul Krugman help topple the French government? According to Business Insider’s Rob Wile, the New York Times columnist “deserves some of the blame”.

The proximate cause of French President Francois Hollande’s decision to call on PM Manuel Valls to form a new government was when two senior ministers criticised the nation’s economic austerity policies. Mr Holland has requested that the prime minister form a new cabinet – certainly without the two offending officials – by Tuesday.

Wile notes that one of the officials – economic minister Arnaud Montebourg – directly quotes Krugman in his controversial comments to Le Monde. Here’s Mr Montebourg’s response after being asked whether Europe has tilted too far toward austerity:

That’s not my observation, that’s the diagnosis of financial institutions across the world, starting with the IMF which, whose director, Christine Lagarde, warned European leaders about an excess of budget consolidation. Paul Krugman, a Nobel laureate, also wrote on Aug. 13, “The nightmare scenario in Europe is not a hypothetical. The news that industrial production has ground to a halt raises the prospect of a new recession in Europe  its primary cause, austerity.” These warnings have also been sounded by other leaders of world powers including Barack Obama.

If Mr. Krugman’s views are no longer welcome in Paris, I wonder what country would be willing to adopt his strategy.  Cuba’s G/GDP ratio is at 66%, probably a tad high for even Paul Krugman. And don’t forget that this is the guy who thinks market monetarists are a failure because our views aren’t popular with GOP Congressmen.

PS.  Mean-spirited Sweden’s government scrapes by spending a measly 51.2% of GDP.

HT:  Patrick Sullivan

2001: A Market Odyssey (Shiller out of sample)

Any fool can data mine and find spurious correlations.  The real test is how they do out of sample. Robert Shiller became famous in 1996 with his “irrational exuberance” claim (or at least one degree of separation from famous, as it was when Greenspan repeated this claim that the public took notice.)

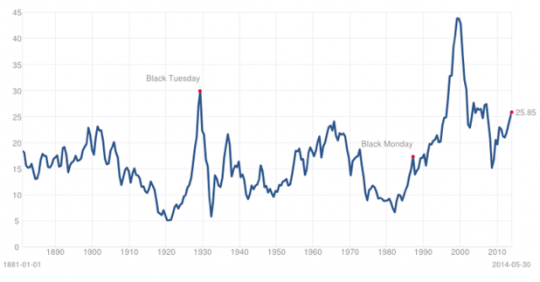
Shiller’s model looks at the ratio of stock prices to an average of inflation-adjusted earnings over the previous 10 years. When he made the call this ratio was near the mid-20s, well about the historical average of 16.  So how’s this model done since?

Not well at all.  I just saw the S&P hit 2001 as I wrote this. Back in 2010 his model was telling us that the S&P was 20% overvalued, when it was at 1070. Take a look at the ratio over time.

Screen Shot 2014-08-25 at 11.16.28 AM

What do you see?  I  see a trend line that seems to have shifted upward from 16 in the mid-1990s, precisely when he made the irrational exuberance claim.  The new average looks like about 25.  And the current ratio is above 25.  So the out of sample test was about as complete a failure as one can imagine.  The model simply did not perform out of sample.

A few other points:

1.  Shiller says that he is still buying stocks at extremely lofty values in 2014, even though in 2010 the S&P was already way overvalued at 1070.  Huh?

2.  Shiller was just awarded a Nobel Prize in economics.  Not for creating a new model like the EMH, but rather for arguing that the EMH was wrong.   But his alternative model has performed poorly in the 2 decades since it was first made famous.  I guess the standard for experimental proof is a bit weaker in economics than in chemistry or physics.

PS.  Of course I am not claiming Shiller is a “fool.”  When I first saw his model I thought it was the most impressive anti-EMH model out there.  The EMH needs to be challenged by the very best, and challenged frequently.  But in the end I suspect the EMH will always come out on top, as other models fall by the wayside.

PPS.  The Sumner model:  25 is the new normal for the PE10 ratio.  Until it isn’t.